Jan 102014
 

For the first time in, well, eons (at least in my personal experience), the CBC was like the old CBC again. The Fifth Estate had an hour-long report entitled Silence of the Labs, on the Harper’s government’s assault (there really is no better word) on the integrity of federally supported science in Canada.

There was very little in the report that I have not previously read about, but then again, my interest in science policy is probably not that of the average viewer. Which is why I am glad that the CBC did this, bringing awareness of what is going on to a broader audience.

No doubt what they did will be denounced by the Harper government and their supporters. And, as the program mentioned, technically they have a point: federally employed scientists do not have a legal entitlement to speak their minds or indeed to complain if research they happen to like is no longer funded.

However… as a citizen, I would like… no, scratch that, I demand that my government uses unbiased, factual science as its guide and that they do not muzzle honest scientists who try to bring these facts to the public with no government minder present.

This is a very significant reason why I hope that Mr. Harper will be defeated in the upcoming elections. Just to be clear, I don’t dislike Harper… how can I dislike a fellow cat lover? I also have no reason to doubt his personal integrity. However, I dislike his policies and his autocratic style of government. I sincerely hope that our next government will undo at least some of the harm that this government inflicted upon us.

 Posted by at 11:27 pm
Jan 082014
 

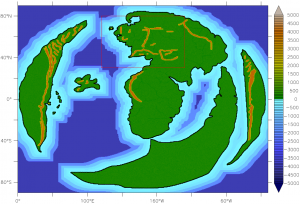
I just stumbled across some new research by climatologist Dan Lunt, who applied modern climate models to the geography and topography of Middle Earth. Yes, Tolkien’s Middle Earth, where hobbits, elves, dwarves, dragons, ents, orcs and other creatures live.

Prepared for possible interest by non-human readers, Lunt (writing under the pseudonym Radagast the Brown… or may be he *is* Radagast the Brown?) helpfully provided translations of his paper into Elvish and Dwarvish.

I couldn’t help but notice, though, that the list of references is missing from the translations.

Also, I wonder… does Google Translate know Elvish and Dwarvish?

 Posted by at 2:39 pm
Dec 312013
 

So the other day, I solved this curious mathematics puzzle using repeated applications of Pythagoras’s theorem and a little bit of algebra.

Now I realize that there is a much simpler form of the proof.

The exercise was to prove that, given two semicircles drawn into a bigger circle as shown below, the sum of the areas of the semicircles is exactly half that of the larger circle.

Again, I’m inserting a few blank lines before presenting my proof.


Once again I am labeling some vertices in the diagram for easy reference.

Our goal is to prove that the area of a circle with radius AO is twice the sum of the areas of two semicircles, with radii AC and BD. But that is the same as proving that the area of a circle with radius AO is equal to the sum of the areas of two circles, with radii AC and BD.

The ACO< angle is a right angle. Therefore, the area of a circle with radius AO is the sum of the areas of circles with radii AC and CO. (To see this, just multiply the theorem of Pythagoras by π.) So if only we could prove that CO = BD, our proof would be complete.

Since AO = BO, they are the sides of the isosceles triangle ABO. Now if we were to pick a point O on the line CD such that CO‘ = BD, the ACO and ODB triangles will be identical (CD being the sum of AC and BD by construction). Therefore, AO‘ = BO, and the ABO triangle would be another isosceles triangle with its third vertex on the CD line. Clearly that is not possible, so O = O, and therefore, CO = BD. This concludes the proof.

 Posted by at 8:16 am
Dec 292013
 

The other day, I ran across a cute geometry puzzle on John Baez’s Google+ page. I was able to solve it in a few minutes, before I read the full post that suggested that this was, after all, a harder-than-usual area puzzle. Glad to see that, even though the last high school mathematics competition in which I participated was something like 35 years ago, I have not yet lost the skill.

Anyhow, the puzzle is this: prove that the area of the two semicircles below is exactly half the area of the full circle.

I am going to insert a few blank lines here before providing my solution.


I start with labeling some vertices on the diagram and also drawing a few radii and other lines to help.

Next, let’s call the radii of the two semicircles as \(a\) and \(b\). Then, we have
\begin{align}
(AC)&= a,\\
(BD)&= b.
\end{align}Now observe that
\begin{align}
(OA) = (OB) = r,
\end{align}and also
\begin{align}
(CD)&= a + b,\\
(OD)&= a + b~- (OC).
\end{align}The rest is just repeated application of the theorem of Pythagoras:
\begin{align}
(OC)^2&= r^2 – a^2,\\
(OD)^2&= r^2 – b^2,
\end{align}followed by a bit of trivial algebra:
\begin{align}
(OC)^2 + a^2&= [a + b – (OC)]^2 + b^2,\\
0&= 2(a + b)[b – (OC)],\\
(OC)&= b.
\end{align}Therefore,
\begin{align}
a^2+b^2=r^2,
\end{align}which means that the area of the full circle is twice the sum of the areas of the two semicircles, which is what we set out to prove.

I guess I have not yet lost my passion for pointless, self-serving mathematics.

 Posted by at 8:45 pm
Dec 242013
 

Year after year, as Christmas Eve nears, I recall the Christmas message of Apollo 8 astronaut Frank Borman. Here is what he said in 1968, 45 years ago: “And from the crew of Apollo 8, we close with good night, good luck, a Merry Christmas and God bless all of you – all of you on the good Earth.

Amen.

 Posted by at 2:52 pm
Dec 172013
 

Damn it’s cold this morning. Negative 26 Centigrade. Or 27 if I believe the local news. And it’s not even winter yet!

To be sure, I still prefer to live in the Great White North instead of any of the numerous southerly climates full of crazy people, but sometimes, it’s a bit too much. Like, when you feel like you need to put on a spacesuit just to step outside to grab your newspaper from your doorstep.

Yes, I still subscribe to a newspaper. Or rather, I again subscribe to a paper after canceling my Globe and Mail subscription more than a decade ago. I accepted their offer for a free three-month subscription back in the summer, and I became used to it. More importantly, I realized that there are things I’d never even read or hear about had they not been in the paper. Electronic media is great, but it tends to deliver the news that you actually want to hear. Especially as services like Google News or Facebook employ sophisticated algorithms that try to predict what you’re most likely to read based on your past behavior. So if you wish to step outside of your comfort zone, to have your views challenged, not simply confirmed… well, a newspaper helps.

Besides… as a last resort, you can also use a newspaper to start a fire to keep warm.

 Posted by at 7:39 am
Dec 122013
 

I am reading a very interesting paper by Christian Beck, recently published in Physical Review Letters.

Beck revives the proposal that at least some of the as yet unobserved dark matter in the universe may be in the form of axions. But he goes further: he suggests that a decade-old experiment with superconducting Josephson-junctions that indicated the presence of a small, unexplained signal may in fact have been a de facto measurement of the axion background in our local galactic neighborhood.

If true, Beck’s suggestion has profound significance: not only would dark matter be observable, but it can be observed with ease, using a tabletop experiment!

What is an axion? The Standard Model of particle physics (for a very good comprehensive review, I recommend The Standard Model: A Primer by Cliff Burgess and Guy Moore, Cambridge University Press, 2007) can be thought of as the most general theory based on the observed particle content in the universe. By “most general”, I mean specifically that the Standard Model can be written in the form of a Lagrangian density, and all the terms that can be present do, in fact, correspond to physically observable phenomena.

All terms except one, that is. The term, which formally reads

\begin{align}{\cal L}_\Theta=\Theta_3\frac{g_3^2}{64\pi^2}\epsilon^{\mu\nu\lambda\beta}G^\alpha_{\mu\nu}G_{\alpha\lambda\beta},\end{align}

where \(G\) represents gluon fields and \(g_3\) is the strong coupling constant (\(\epsilon^{\mu\nu\lambda\beta}\) is the fully antisymmetric Levi-Civita pseudotensor), does not correspond to any known physical process. This term would be meaningless in classical physics, on account of the fact that the coupling constant \(\Theta_3\) multiplies a total derivative. In QCD, however, the term still has physical significance. Moreover, the term actually violates charge-parity (CP) symmetry.

The fact that no such effects are observed implies that \(\Theta_3\) is either 0 or at least, very small. Now why would \(\Theta_3\) be very small? There is no natural explanation.

However, one can consider introducing a new scalar field into the theory, with specific properties. In particular this scalar field, which is called the axion and usually denoted by \(a\), causes \(\Theta_3\) to be replaced with \(\Theta_{3,{\rm eff}}=\Theta_3 + \left<a\right>/f_a\), where \(f_a\) is some energy scale. If the scalar field were massless, the theory would demand \(\left<a\right>/f_a\) to be exactly \(-\Theta_3\). However, if the scalar field is massive, a small residual value for \(\Theta_{3,{\rm eff}}\) remains.

As for the Josephson-junction, it is a superconducting device in which two superconducting layers are separated by an isolation layer (which can be a normal conductor, a semiconductor, or even an insulator). As a voltage is introduced across a Josephson-junction, a current can be measured. The peculiar property of a Josephson-junction is the current does not vanish even as the voltage is reduced to zero:

(The horizontal axis is voltage, the vertical axis is the current. In a normal resistor, the current-voltage curve would be a straight line that goes through the origin.) This is the DC Josephson effect; a similar effect arises when an AC voltage is applied, but in that case, the curve is even more interesting, with a step function appearance.

The phase difference \(\delta\) between the superconductors a Josephson-junction is characterized by the equation

\begin{align}\ddot{\delta}+\frac{1}{RC}\dot{\delta}+\frac{2eI_c}{\hbar C}\sin\delta&=\frac{2e}{\hbar C}I,\end{align}

where \(R\) and \(C\) are the resistance and capacitance of the junction, \(I_c\) is the critical current that characterizes the junction, and \(I\) is the current. (Here, \(e\) is the electron’s charge and \(\hbar\) is the reduced Planck constant.)

Given an axion field, represented by \(\theta=a/f_a\), in the presence of strong electric (\({\bf E}\)) and magnetic (\({\bf B}\)) fields, the axion field satisfies the equation

\begin{align}\ddot{\theta}+\Gamma\dot{\theta}+\frac{m_a^2c^4}{\hbar^2}\sin\theta=-\frac{g_\lambda c^3e^2}{4\pi^2f_a^2}{\bf E}{\bf B},\end{align}

where \(\Gamma\) is a damping parameter and \(g_\lambda\) is a coupling constant, while \(m_a\) is the axion mass and of course \(c\) is the speed of light.

The formal similarity between these two equations is striking. Now Beck suggests that the similarity is more than formal: that in fact, under the right circumstances, the axion field and a Josephson-junction can form a coupled system, in which resonance effects might be observed. The reason Beck gives is that the axion field causes a small CP symmetry perturbation in the Josephson-junction, to which the junction reacts with a small response in \(\delta\).

Indeed, Beck claims that this effect was, in fact, observed already, in a 2004 experiment by Hoffman, et al., who attempted to measure the noise in a certain type of Josephson-junction. In their experiment, a small, persistent peak appeared at a voltage of approximately 0.055 mV:

hoffmann

If Beck is correct, this observation corresponds to an axion with a mass of 0.11 meV (that is to say, the electron is some five billion times heavier than this axion) and the local density of the axion field would be about one sixth the presumed dark matter density in this region of the Galaxy.

I don’t know if Beck is right or not, but unlike most other papers about purported dark matter discoveries, this one does not feel like clutching at straws. It passes the “smell test”. I’d be very disappointed if it proved to be true (I am not very much in favor of the dark matter proposal) but if it is true, I think it qualifies as a Nobel-worthy discovery. It is also eerily similar to the original discovery of the cosmic microwave background: it was first observed by physicists who were not at all interested in cosmology but instead, were just trying to build a low-noise microwave antenna.

 Posted by at 11:42 am
Nov 302013
 

It’s only November, for crying out loud, but winter has arrived with a vengeance.

Yesterday, the temperature was -21 centigrade (at least according to Microsoft; on the Weather Channel, it was “only” -18 I believe.)

Today, we are enjoying a balmy -12.

And winter is officially still more than three weeks away.

Brrrr.

 Posted by at 2:40 pm
Nov 302013
 

While responding to a question on ResearchGate, I thought about black holes and event horizons.

When you study general relativity, you learn that a star that is dense enough and massive enough will undergo gravitational collapse. The result will be a black hole, an object from which nothing, not even light, can escape. A black hole is surrounded by a spherical surface, its event horizon. It is not a physical surface, but a region that is characterized by the fact that the geometric distortions of spacetime due to gravity become extreme here. Once you cross the horizon, there is no turning back. It acts as a one-way membrane. Anything inside will unavoidably fall into the so-called singularity at the center of the black hole. What actually happens there, no-one really knows; gravity becomes so strong that quantum effects cannot be ignored, but since we don’t have a working quantum theory of gravity, we can’t really tell what happens.

That said, when you study general relativity, you also learn that a distant observer (such as you) can never see the horizon form. The horizon will forever remain in the distant observer’s infinite future. Similarly, we never see an object (or even a ray of light) cross the horizon. For a distant observer, any information coming from that infalling object (or ray of light) will become dramatically redshifted, so much so that the object will appear to crawl to a halt, essentially remaining frozen near the horizon. But you won’t actually get a chance to see even that; that’s because due to the redshift, rays of light from the object will become ever longer wavelength radio waves, until they become unobservable. So why do we bother even thinking about something that provably never happens in a finite amount of time?

For one thing, we know that even though a distant observer cannot see a horizon form, an infalling observer can. So purely as a speculative exercise, we would like to know what this infalling observer might experience.

And then there is the surface of last influence. We may not see an object cross the horizon, but there is a point in time beyond which we can no longer influence an infalling object. That is because any influence from us, even a beam of light, will not reach the object before the object crosses the horizon.

This is best illustrated in a so-called Penrose diagram (named after mathematician Roger Penrose, but also known as a conformal spacetime diagram.) In this diagram, spacetime is represented using only two dimensions on a sheet of paper; two spatial dimensions are suppressed. Furthermore, the remaining two dimensions are grossly distorted, so much so that even the “point at infinity” is drawn at a finite distance from the origin. However, the distortion is not random; it is done in such a way that light rays are always represented by 45° lines. (Such angle-preserving transformations are called “conformal”; hence the name.)

So here is the conformal spacetime diagram for a black hole, showing also an infalling object and a distant observer trying to communicate with this object:

Time, in this diagram, passes from bottom to top. The world line of an object is a (not necessary straight) line that also moves from bottom to top, and is never more then 45° away from the vertical (as that would represent faster-than-light motion).

In this diagram, a piece of infalling matter crosses the horizon. It is clear from the diagram that once that happens, there is nothing that can be done to avoid hitting the singularity near the top of the diagram. To escape, the object would need to move faster than light, in order to cross, from the inside to the outside, the 45° line representing the horizon.

An observer traveling along with the infalling object can bounce, e.g., radar waves off that object. However, that cannot go on forever. Once the observer’s world line crosses the line drawn to represent the surface of last influence, his radar waves will no longer reach the infalling object outside the horizon. Any echo from the object, therefore, will not be seen outside the horizon; it will remain within the horizon and eventually be swallowed by the singularity.

So does the existence of this surface of last influence mean that the event horizon exists for real, even though we cannot see it? This was an argument made in the famous textbook on relativity, Gravitation by Misner, Thorne and Wheeler. However, I tend to disagree. Sure, once you cross the surface of last influence, you can no longer influence an infalling object. Nonetheless, you still won’t see the object actually cross the horizon. Moreover, if the object happens to be, say, a very powerful rocket, its pilot may still change his mind and turn around, eventually re-emerging from the vicinity of the black hole. The surface of last influence remains purely hypothetical in this case; it is defined by the intersection of the infalling object and the event horizon, something that never actually happens.

 Posted by at 2:36 pm
Nov 182013
 

When you have a family member who is gravely ill, you may not have the stamina to pay attention to other things. When you have a family pet that is gravely ill, it’s almost as bad (actually, in some ways it’s worse, as a pet cannot tell what hurts and you cannot explain to the pet why unpleasant medication is necessary or discuss with the pet the available treatment options.)

As I’ve been dealing with a gravely ill cat in the past six weeks, I neglected to pay attention to other things.

I did not add a blog entry on October 31 with my drawing of a Halloween cat.

I did not comment on Remembrance Day. I am very fond of Remembrance Day, because it does not celebrate victory nor does it glorify war; on the contrary, it celebrates sacrifice and laments on the futility of war. This is why I am so unimpressed by the somewhat militantly pacifist “white poppy” campaign; in my view, they completely miss the point. I usually put a stylized poppy in my blog on November 11; not this year, as I spent instead a good portion of that day and the next at the vet.

I most certainly did not comment on that furious (and infuriating) wild hog of a mayor, Toronto’s Rob Ford, or for that matter, the other juicy Canadian political scandal, the Senate expense thing. That despite the fact that for a few days, Canadian news channels were actually exciting to watch (a much welcome distraction in my case), as breaking news from Ottawa was interrupted by breaking news from Toronto or vice versa.

I also did not blog about the continuing shenanigans of Hungary’s political elite, nor the fact that an 80-year old Hungarian writer, Akos Kertesz (not related to Imre Kertesz, the Nobel-laureate) sought, and received, political asylum, having fled Hungary when he became the target of threats and abuse after publishing an article in which he accused Hungarians of being genetically predisposed to subservience.

Nor did I express my concern about the stock market’s recent meteoric rise (the Dow Jones index just hit 16,000) and whether or not it is a bubble waiting to be burst.

And I made no comments about the horrendous typhoon that hit the Philippines, nor did I wonder aloud what Verizon Canada must be thinking these days about their decision to move both their billing and their technical support to that distant country.

Last but certainly not least, I did not write about the physics I am trying to do in my spare time, including my attempts to understand better what it takes for a viable modified gravity theory to agree with laboratory experiments, precision solar system observations, galactic astronomy and cosmological data sets using the same set of assumptions and parameters.

Unfortunately, our cat remains gravely ill. The only good news, if it can be called that, is that yesterday morning, he vomited a little liquid and it was very obviously pink; this strongly suggests that we now know the cause of his anaemia, namely gastrointestinal bleeding. We still don’t know the cause, but now he can get more targeted medication. My fingers remain crossed that his condition is treatable.

 Posted by at 9:34 am
Nov 072013
 

I have been collaborating with John Moffat on his modified gravity theory and other topics since 2007. It has been an immensely rewarding experience.

John is a theoretical physicist who has been active for sixty years. During his amazingly long career, John met just about every one of the iconic figures of 20th century physics. He visited Erwin Schrödinger in a house where Schrödinger lived with his wife and his mistress. He was mentored by Niels Bohr. He studied under Fred Hoyle (the astronomer who coined the term “Big Bang”). He worked under Paul Dirac. He shared office space with Peter Higgs. He took Wolfgang Pauli out for a wet lunch on university funds. He met Feynman, Oppenheimer, and many others. The one iconic physicist Moffat did not meet in person was Albert Einstein; however, Einstein still played a pivotal role in his career, answering letters written to him by a young John Moffat (then earning money as a struggling artist) encouraging him to continue his studies of physics.

Though retired, John remains active as a member of the prestigious Perimeter Institute in Waterloo. I don’t expect him to run out of maverick ideas anytime soon. Rare among physicists his age, John’s knowledge of the science is completely up-to-date, as is his knowledge of the tools of the trade. I’ve seen physicists 20 years his junior struggling with hand-written transparencies (remember those, and the unwieldy projectors?) even as John was putting the finishing touches to his latest PowerPoint presentation on his brand new laptop or making corrections to a LaTeX manuscript.

More recently, John began to write for a broader audience. He already published two excellent books. His first, Reinventing Gravity, describes John’s struggle to create a viable alternative to Einstein’s General Theory of Relativity, a new gravity theory that would explain mysteries such as the rotation of galaxies without resorting to the dark matter hypothesis. John’s second book, Einstein Wrote Back, is a personal memoir, detailing his amazing life as a physicist.

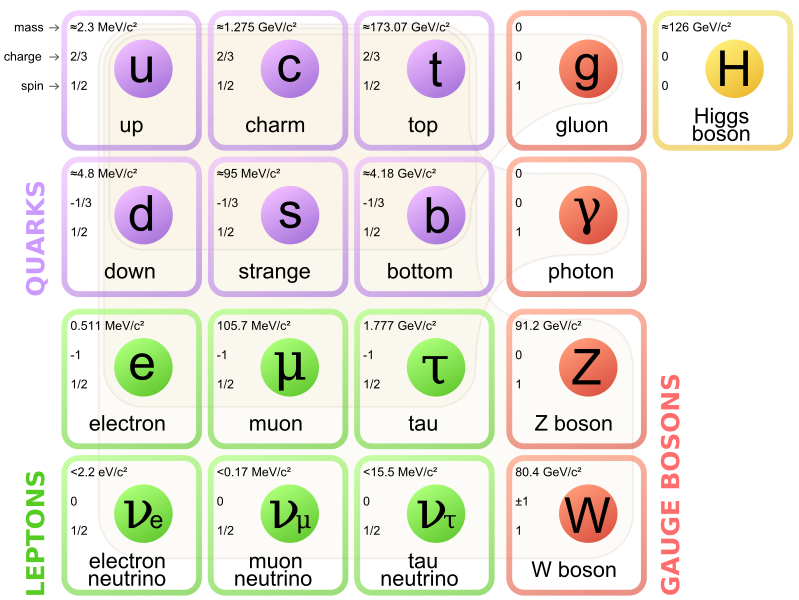
John’s third book, which is about to be published, is perhaps his most ambitious book project yet. Cracking the Particle Code, published by the prestigious Oxford University Press, is about the decades of research in particle physics that resulted in the recent discovery of what is believed to be the elusive Higgs boson, and John’s attempts to explore theoretical alternatives that might make the Higgs boson hypothesis unnecessary, and provide alternative explanations for the particle observed by the Large Hadron Collider.

I had the good fortune of being able to read the manuscript earlier this year.  My first reaction was that John took up an almost impossible task. As many notable physicists, including Einstein, observed, quantum physics is harder, perhaps much harder, than relativity theory. The modern Standard Model of particle physics combines the often arcane rules of quantum field theory with a venerable zoo of particles (12 fermions and their respective antiparticles, four vector bosons, eight gluons and, last but not least, the Higgs boson). Though the theory is immensely successful, it is unsatisfying in many ways, not the least because it fails to account for perhaps the most fundamental interaction of all: gravity. And its predictions, while exact, are very difficult to comprehend even for trained theorists. Reducing data on billions of collisions in a large accelerator to definitive statements about, say, the spin and parity of a newly observed particle is a daunting challenge.

Explaining all this in a form that is accessible to the interested but non-professional reader is the task that John set out to tackle. His text mixes a personal narrative with scientific explanations of these difficult topics. To be sure, the technical part of the text is not an easy read. This is not John’s fault; the topic is very difficult to understand unless you are willing to invest the time and effort to study the mathematics. But John’s personal insights perhaps make the book enjoyable even to those who choose to skip over the more technical paragraphs.

There are two points in particular that I’d like to mention in praise. First, John’s book is amazingly up-to-date; as late as a few weeks ago, John was still making small corrections during the copy editing process to ensure that everything he says is consistent with the latest results from CERN. Second, John’s narrative always makes a clear distinction between standard physics (i.e., the “consensus”) and his own notions. While John is clearly passionate about his ideas, he never forgets the old adage attributed to the late US Senator, Daniel Patrick Moynihan: John knows that he is only entitled to his own opinions, he is not entitled to his own facts, and this is true even if the facts invalidate a theoretical proposal.

I hope John’s latest book sells well. I hope others will enjoy it as much as I did. I certainly recommend it wholeheartedly.

 Posted by at 1:11 pm
Oct 112013
 

Reader’s Digest recently conducted an interesting experiment: they “lost” 12 wallets, filled with about $50 worth of cash and sufficient documentation to locate the owner, in 16 cities around the world. The result: Finns in Helsinki are the most honest with 11 of the 12 wallets returned, whereas in Lisbon, Portugal, the sole wallet that was returned was, in fact, found by a visiting Dutch couple. Finns needless to say, are rejoicing: “we don’t even run red lights,” boasted a Helsinki resident.

So what can we conclude from this interesting experiment? Perhaps shockingly, almost nothing.

This becomes evident if I plot a histogram with the number of wallets returned, and overlay on it a binomial distribution for a probability of 46.875% (which corresponds to the total number of wallets returned, 90 out of 192), I get a curve that is matched very closely by the histogram. Unsurprisingly, there will be a certain probability that in a given city, 1, 2, 3, etc. wallets are returned; and the results of Reader’s Digest match this prediction closely.

So there is no reason for Finns to rejoice or for the Portuguese to feel shame. It’s all just blind luck, after all. And the only valid conclusion we can draw from this experiment is that people are just as likely to be decent folks in Lisbon as in Helsinki.

But how do you explain this to a lay audience? More importantly, how do you prevent a political demagogue from drawing false or unwarranted conclusions from the data?

 Posted by at 9:40 pm
Oct 112013
 

Is this a worthy do-it-yourself neuroscience experiment, or an example of a technology gone berserk, foreshadowing a bleak future?

A US company is planning to ship $99 kits this fall, allowing anyone to turn a cockroach into a remote controlled cyborg. Educational? Or more like the stuff of bad dreams?

For me, it’s the latter. Perhaps it doesn’t help that I am halfway through reading Margaret Atwood’s The Year of the Flood, sequel to Oryx and Crake, a dystopian science fiction novel set in a bleak future in which humanity destroys itself through the reckless use of biotech and related technologies.

A cockroach may not be a beloved animal. Its nervous system may be too small, too simple for it to feel real pain. Nonetheless, I feel there is something deeply disturbing and fundamentally unethical about the idea of turning a living animal into a remote control toy.

To put it more simply: it creeps the hell out of me.

 Posted by at 11:49 am
Sep 272013
 

It is now formally official: global surface temperatures did not increase significantly in the past 15 years or so.

But if skeptics conclude that this is it, the smoking gun that proves that all climate science is hogwash, they better think again. When we look closely, the plots reveal something a lot more interesting.

For starters… this is not the first time global temperatures stagnated or even decreased somewhat since the start of recordkeeping. There is a roughly 20-year period centered around 1950 or so, and another, even longer period centered roughly around 1890. This looks in fact like evidence that there may be something to the idea of a 60-year climate cycle. However, the alarming bit is this: every time the cycle peaks, temperatures are higher than in the previous cycle.

The just released IPCC Summary for Policymakers makes no mention of this cycle but it does offer an explanation for the observed stagnating temperatures. These are probably a result of volcanic activity, they tell us, the solar cycle, and perhaps mismodeling the effects of greenhouse gases and aerosols, but they are not exactly sure.

And certainty is characterized with words like “high confidence,” “medium confidence” and such, with no definitions given. These will be supplied, supposedly, in the technical report that will be released on Monday. Nonetheless, the statement that “Probabilistic estimates […] are based on statistical analysis of observations or model results, or both, and expert judgment” [emphasis mine] does not fill me with confidence, if you will pardon the pun.

In fact, I feel compelled to compare this to the various reports and releases issued by the LHC in recent years about the Higgs boson. There was no “expert judgment”. There were objective statistical analysis methods and procedures that were thoroughly documented (even though they were often difficult to comprehend, due to their sheer complexity.) There were objective standards for claiming a discovery.

Given the extreme political sensitivity of the topic, I think the IPCC should adopt similar or even more stringent standards of analysis as the LHC. Do away with “expert judgment” and use instead proper statistical tools to establish the likelihood of specific climate models in the light of the gathered data. And if the models do not work, e.g., if they failed to predict stagnating temperatures, the right thing to do is say that this is so; there is no need for “expert judgment”. Just state the facts.

 Posted by at 10:45 pm
Sep 272013
 

I’ve been hesitant to write about this, as skeptics will already have plenty to gripe about, I don’t need to pile on. And I swear I am not looking for excuses to bash the IPCC, not to mention that I have little sympathy or patience for skeptics who believe that an entire body of science is just one huge scam to make Al Gore and his buddies rich.

But… I was very disappointed to see plots in the latest IPCC “Summary for Policymakers” report that appear unnecessarily manipulative.

Wikipedia describes these as truncated or “gee-whiz” graphs: graphs in which the vertical axis does not start at zero. This can dramatically change the appearance of a plot, making small variations appear much larger than they really are.

To be clear, the use of truncated plots is often legitimate. Perhaps the plot compares two quantities that are of a similar magnitude. Perhaps the plot shows a quantity the absolute magnitude of which is irrelevant. Perhaps the quantity is such that “0” has no special meaning or it is not a natural start of the range (e.g., pH, temperature in Centigrade).

But in other cases, this practice can be viewed as misleading, intellectually dishonest (for instance, it is common for financial companies to manipulate plots this way to make their market performance appear more impressive than it really is) or outright fraudulent.

So here we are, the 2013 IPCC report’s summary for policymakers has been released in draft form, and what do I see in it? Several key plots that have been presented in truncated “gee-whiz” form, despite the fact that the quantities they represent are such that their absolute magnitudes are relevant, that their variability must be measured against their absolute magnitudes, and where zero is a natural start of the range.

I am presenting the original plots on the left and my crudely “untruncated” versions on the right:

This is not kosher, especially in a document that is intended for consumption by a lay audience who may not have the scientific education to spot such subtleties.

The document is still labeled a draft, with copy editing in particular yet to take place. Here’s to hoping that these plots (and any similar plots that may appear in the main report) are corrected before publication, to avoid the impression of trying to exaggerate the case for climate change. Scientists should be presenting the science objectively and leave the manipulation, even inadvertent manipulation, to politicians.

 Posted by at 10:22 pm
Sep 202013
 

Last week, it was all over the news: Voyager 1 has left the solar system.

Except that it really didn’t. Voyager 1’s trajectory is, and will continue to be, dominated by the Sun’s gravity for thousands of years. Voyager 1 is significantly closer to the Sun than Sedna (one of the icy dwarfs in the outer solar system) at aphelion. And then there is the hypothesized Oort cloud, a spherical cloud of planetesimals roughly a light year from the Sun. Voyager 1 will take thousands of years to travel that distance.

Of course, Voyager 1 is way outside the orbit of the outermost planet, Neptune. But that happened decades ago, back in the 1980s. By 1990, Voyager 1 was far enough from the Sun to be able to take its famous “family portrait”, a mosaic that covered six of the eight planets (Mars was too faint, while Mercury was too close to the Sun.)

So what exactly happened this month? Well, Voyager 1 crossed the heliopause, the boundary where the solar wind collides with the interstellar medium. It is also the location where magnetic fields are no longer dominated by the Sun.

So in this sense, Voyager 1 has indeed crossed into the interstellar medium. The particles its instruments sample are the particles found in interstellar space, not particles emitted by the Sun.

So it is a significant milestone, but it is somewhat misleading to suggest that “Voyager 1 has left the solar system”, which we heard so many times in the past several days.

 Posted by at 4:40 pm
Sep 202013
 

Grote_Antenna_WheatonThe world’s first parabolic radio telescope was, astonishingly, built in someone’s back yard.

I am reading about the radio telescope of American amateur radio enthusiast and amateur astronomer Grote Reber.

In 1937, Reber built a 9-meter parabolic reflector in his family’s back yard.

Reber was the first to make a systematic survey of the radio sky, not only confirming Jansky’s earlier, pioneering discovery of radio waves from the Milky Way but also discovering radio sources such as Cygnus X-1 and Cassiopeia A.

grote5

For nearly a decade, Reber was the only person in the world doing radio astronomy.

Reber had a long life. He spent his final years in Tasmania, one of the few places on Earth where occasionally, very low frequency radio waves penetrate the ionosphere and are detectable by a ground-based antenna.

 Posted by at 2:55 pm
Sep 172013
 

It has been known for some time: In the past decade, perhaps decade and a half, there was no significant global warming.

There are many explanations proposed for this slowdown/pause, and the actual cause is likely a combination of these: ocean surface cooling, natural climate oscillations, an unusual solar minimum, water vapor, aerosols, you name it.

Here is one problem with these explanations: These are the same ideas that were proposed, as alternatives to anthropogenic CO2, as causes behind the observed warming, by climate change “skeptics”, only to be summarily dismissed by many in the climate change community as denialist crackpottery.

Sadly, this may very well mean that climate skeptics will claim victory, and those inclined to listen to them will conclude that all this global warming hogwash was just some scam dreamed up by Al Gore and his cronies. Meanwhile, we tend to forget about other things that elevated atmospheric CO2 levels do, such as ocean acidification; not to mention other, equally threatening global environmental concerns, for instance species extinction occurring on a scale not seen since the day of the dinosaurs.

 Posted by at 7:43 pm
Sep 062013
 

Last December, I wrote a blog entry in which I criticized one aspect of the LHC’s analysis of the scalar particle discovered earlier this year, which is believed to be the long sought-after Higgs boson.

The Higgs boson is a scalar. It is conceivable that the particle observed at the LHC is not the Higgs particle but an “impostor”, some composite of known (and perhaps unknown) particles that behaves like a scalar. Or, I should say, almost like a scalar, as the ground state of such composites would likely behave like a pseudoscalar. The difference is that whereas a scalar-valued field remains unchanged under a reflection, a pseudoscalar field changes sign.

This has specific consequences when the particle decays, apparent in the angles of the decay products’ trajectories.

Several such angles are measured, but the analysis used at the ATLAS detector of the LHC employs a method borrowed from machine learning research, called a Boosted Decision Tree algorithm, that synthesizes a single parameter that has maximum sensitivity to the parity of the observed particle. (The CMS detector’s analysis uses a similar approach.)

The result can be plotted against scalar vs. pseudoscalar model predictions. This plot, shown below, does not appear very convincing. The data points (which represent binned numbers of events) are all over the place with large errors. Out of a total of only 43 events (give or take), more than 25% are the expected background, only 30+ events represent an actual signal. And the scalar vs. pseudoscalar predictions are very similar.

This is why, when I saw that the analysis concluded that the scalar hypothesis is supported with a probability of over 97%, I felt rather skeptical. And I thought I knew the reason: I thought that the experimental error, i.e., the error bars in the plot above, was not properly accounted for in the analysis.

Indeed, if I calculate the normalized chi-square per degree of freedom, I get \(\chi^2_{J^P=0^+} = 0.247\) and \(\chi^2_{J^P=0^-} = 0.426\), respectively, for the two hypotheses. The difference is not very big.

Alas, my skepticism was misplaced. The folks at the LHC didn’t bother with chi-squares, instead they performed a likelihood analysis. The question they were asking was this: given the set of observations available, what are the likelihoods of the scalar and the pseudoscalar scenarios?

At the LHC, they used likelihood functions and distributions derived from the actual theory. However, I can do a poor man’s version myself by simply using the Gaussian normal distribution (or a nonsymmetric version of the same). Given a data point \(D_i\), a model value \(M_I\), and a standard deviation (error) \(\sigma_i\), the probability that the data point is at least as far from \(M_i\) as \(D_i\) is given by

\begin{align}
{\cal P}_i=2\left[1-\Psi\left(\frac{|D_i-M_i|}{\sigma_i}\right)\right],
\end{align}

where \(\Psi(x)\) is the cumulative normal distribution.

Now \({\cal P}_i\) also happens to be the likelihood of the model value \(M_i\) given the data point \(D_i\) and standard distribution \(\sigma_i\). If we assume that the data points and their errors are statistically indepdendent, the likelihood that all the data points happen to fall where they fell is given by

\begin{align}
{\cal L}=\prod\limits_{i=1}^N{\cal P}_i.
\end{align}

Taking the data from the ATLAS figure above, the value \(q\) of the commonly used log-likelihood ratio is

\begin{align}
q=\ln\frac{{\cal L}(J^P=0^+)}{{\cal L}(J^P=0^-)}=2.89.
\end{align}

(The LHC folks calculated 2.2, which is “close enough” for me given that I am using a naive Gaussian distribution.)

Furthermore, if I choose to believe that the only two viable hypothesis for the spin-parity of the observed particle are the scalar and pseudoscalar scenarios (e.g., if other experiments already convinced me that alternatives, such as intepreting the result as a spin-2 particle, can be completely excluded) I can normalize these two likelihoods and interpret them as probabilities. The probability of the scalar scenario is then \(e^{2.89}\simeq 18\) times larger than the probability of the pseudoscalar scenario. So if these probabilities add up to 100%, that means that the scalar scenario is favored with a probability of nearly 95%. Not exactly “slam dunk” but pretty darn convincing.

As to the validity of the method, there is, in fact, a theorem called the Neyman-Pearson lemma that states that the likelihood-ratio test is the most powerful test for this type of comparison of hypotheses.

But what about my earlier objection that the observational error was not properly accounted for? Well… it appears that it was, after all. In my “poor man’s” version of the analysis, the observational error was used to select the appropriate form of the normal distribution, through \(\sigma_i\). In the LHC’s analysis, I believe, the observational error found its was into the Monte-Carlo simulation that was used to develop a physically more accurate probability distribution function that was used for the same purpose.

Even clever people make mistakes. Even large groups of very clever people sometimes succumb to groupthink. But when you bet against clever people, you are likely to lose. I thought I spotted an error in the analysis performed at the LHC, but all I really found were gaps in my own understanding. Oh well… live and learn.

 Posted by at 4:12 pm