There is an excellent diagram accompanying an answer on StackExchange, and I’ve been meaning to copy it here, because I keep losing the address.
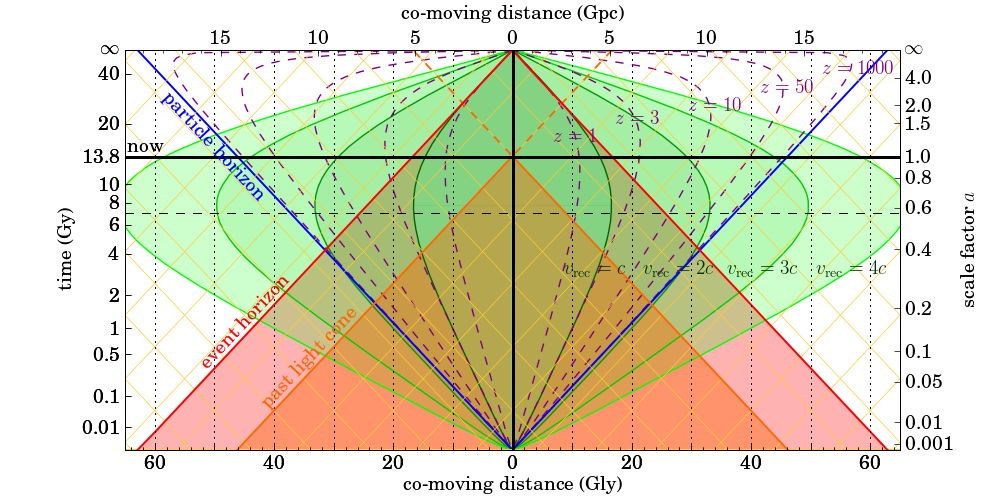
The diagram summarizes many measures of cosmic expansion in a nice, compact, but not necessarily easy-to-understand form:
So let me explain how to read this diagram. First of all, time is going from bottom to top. The thick horizontal black line represents the moment of now. Imagine this line moving upwards as time progresses.
The thick vertical black line is here. So the intersection of the two thick black lines in the middle is the here-and-now.
Distances are measured in terms of the comoving distance, which is basically telling you how far a distant object would be now, if you had a long measuring tape to measure its present-day location.
The area shaded red (marked “past light cone”) is all the events that happened in the universe that we could see, up to the moment of now. The boundary of this area is everything in this universe from which light is reaching us right now.
So just for fun, let us pick an object at a comoving distance of 30 gigalightyears (Gly). Look at the dotted vertical line corresponding to 30 Gly, halfway between the 20 and 40 marks (either side, doesn’t matter.) It intersects the boundary of the past light cone when the universe was roughly 700 million years old. Good, there were already young galaxies back then. If we were observing such a galaxy today, we’d be seeing it as it appeared when the universe was 700 million years old. Its light would have spent 13.1 billion years traveling before reaching our instruments.
Again look at the dotted vertical line at 30 Gly and extend it all the way to the “now” line. What does this tell you about this object? You can read the object’s redshift (z) off the diagram: its light is shifted down in frequency by a factor of about 9.
You can also read the object’s recession velocity, which is just a little over two times the vacuum speed of light. Yes… faster than light. This recession velocity is based on the rate of change of the scale factor, essentially the Hubble parameter times the comoving distance. The Doppler velocity that one would deduce from the object’s redshift yields a value less than the vacuum speed of light. (Curved spacetime is tricky; distances and speeds can be defined in various ways.)
Another thing about this diagram is that in addition to the past, it also sketches the future, taking into account the apparent accelerating expansion of the universe. Notice the light red shaded area marked “event horizon”. This area contains everything that we will be able to see at our present location, throughout the entire history of the universe, all the way to the infinite future. Things (events) outside this area will never be seen by us, will never influence us.
Note how the dotted line at 30 Gly intersects this boundary when the universe is about 5 billion years old. Yes, this means that we will only ever see the first less than 5 billion years of existence of a galaxy at a comoving distance of 30 Gly. Over time, light from this galaxy will be redshifted ever more, until it eventually appears to “freeze” and disappears from sight, never appearing to become older than 5 billion years.
Notice also how the dashed curves marking constant values of redshift bend inward, closer and closer to the “here” location as we approach the infinite future. This is a direct result of accelerating expansion: Things nearer and nearer to us will be caught up in the expansion, accelerating away from our location. Eventually this will stop, of course; cosmic acceleration will not rip apart structures that are gravitationally bound. But we will end up living in a true “island universe” in which nothing is seen at all beyond the largest gravitationally bound structure, the local group of galaxies. Fortunately that won’t happen anytime soon; we have many tens of billions of years until then.
Lastly, the particle horizon (blue lines) essentially marks the size of the visible part of the universe at any given time. Notice how the width of the interval marked by the intersection of the now line and the blue lines is identical to the width of the past light cone at the bottom of this diagram. Notice also how the blue lines correspond to infinite redshift.
As I said, this diagram is not an easy read but it is well worth studying.


