There is an excellent diagram accompanying an answer on StackExchange, and I’ve been meaning to copy it here, because I keep losing the address.
The diagram summarizes many measures of cosmic expansion in a nice, compact, but not necessarily easy-to-understand form:
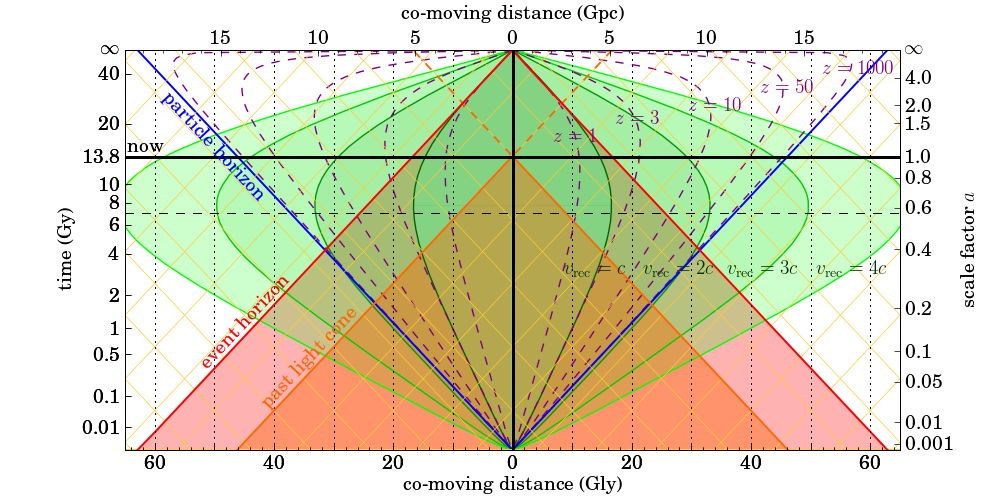
So let me explain how to read this diagram. First of all, time is going from bottom to top. The thick horizontal black line represents the moment of now. Imagine this line moving upwards as time progresses.
The thick vertical black line is here. So the intersection of the two thick black lines in the middle is the here-and-now.
Distances are measured in terms of the comoving distance, which is basically telling you how far a distant object would be now, if you had a long measuring tape to measure its present-day location.
The area shaded red (marked “past light cone”) is all the events that happened in the universe that we could see, up to the moment of now. The boundary of this area is everything in this universe from which light is reaching us right now.
So just for fun, let us pick an object at a comoving distance of 30 gigalightyears (Gly). Look at the dotted vertical line corresponding to 30 Gly, halfway between the 20 and 40 marks (either side, doesn’t matter.) It intersects the boundary of the past light cone when the universe was roughly 700 million years old. Good, there were already young galaxies back then. If we were observing such a galaxy today, we’d be seeing it as it appeared when the universe was 700 million years old. Its light would have spent 13.1 billion years traveling before reaching our instruments.
Again look at the dotted vertical line at 30 Gly and extend it all the way to the “now” line. What does this tell you about this object? You can read the object’s redshift (z) off the diagram: its light is shifted down in frequency by a factor of about 9.
You can also read the object’s recession velocity, which is just a little over two times the vacuum speed of light. Yes… faster than light. This recession velocity is based on the rate of change of the scale factor, essentially the Hubble parameter times the comoving distance. The Doppler velocity that one would deduce from the object’s redshift yields a value less than the vacuum speed of light. (Curved spacetime is tricky; distances and speeds can be defined in various ways.)
Another thing about this diagram is that in addition to the past, it also sketches the future, taking into account the apparent accelerating expansion of the universe. Notice the light red shaded area marked “event horizon”. This area contains everything that we will be able to see at our present location, throughout the entire history of the universe, all the way to the infinite future. Things (events) outside this area will never be seen by us, will never influence us.
Note how the dotted line at 30 Gly intersects this boundary when the universe is about 5 billion years old. Yes, this means that we will only ever see the first less than 5 billion years of existence of a galaxy at a comoving distance of 30 Gly. Over time, light from this galaxy will be redshifted ever more, until it eventually appears to “freeze” and disappears from sight, never appearing to become older than 5 billion years.
Notice also how the dashed curves marking constant values of redshift bend inward, closer and closer to the “here” location as we approach the infinite future. This is a direct result of accelerating expansion: Things nearer and nearer to us will be caught up in the expansion, accelerating away from our location. Eventually this will stop, of course; cosmic acceleration will not rip apart structures that are gravitationally bound. But we will end up living in a true “island universe” in which nothing is seen at all beyond the largest gravitationally bound structure, the local group of galaxies. Fortunately that won’t happen anytime soon; we have many tens of billions of years until then.
Lastly, the particle horizon (blue lines) essentially marks the size of the visible part of the universe at any given time. Notice how the width of the interval marked by the intersection of the now line and the blue lines is identical to the width of the past light cone at the bottom of this diagram. Notice also how the blue lines correspond to infinite redshift.
As I said, this diagram is not an easy read but it is well worth studying.
I have a question concerning the above spacetime diagram. It’s neatly all clear about this figure, especially because it is very similar to the diagram in the Davis and Lineweaver papers. However, the set of curves for z=constant (= 1, 3, 10, 50, 100) are added in the diagram. My question is, how are these curves calculated, ie, what is the mathematical relation plotted here?
I’d be glad if you answer this. Thanks in advance.
Rene Kail
The StackExchange link (click the image, or the link in the paragraph above the image) takes you to the answer from which this diagram came. That answer has all the details. My understanding is that \(1+z(t_{\rm ob}) = a(t_{\rm ob})/a(t_{\rm em})\) gives the redshift as a function of the scale factor at the time of emission and observation; the scale factor can be calculated as usual; and the time of observation can, in turn, be calculated from the time of emission and the comoving distance.
After studying the above text and the spacetime diagram more thouroughly I spotted several inconsistencies:
– 5th paragraph: the comoving distance should read 30 Glyr (not 40)
– 6th paragraph: the shift factor is 1+z =1+50 =51 (important correction for low z)
– in the diagram the black dotted line for q = 0 should be placed slightly above a = 0.6 (the exact value is 0.613)
Greetings from Switzerland
Rene Kail
Not sure what you mean by “should read”. Why would I be required to pick 30 Gly? It is an entirely arbitrary choice of mine. I picked 40 Gly because that’s what I wanted to pick. Or are you suggesting that the horizontal axis is mislabeled? That doesn’t appear to be the case either.
Re. 50 vs. 51, when I am eyeballing a diagram, I am not aiming for better than 2% accuracy.
You are right about the 0.613. I just did a quick-and-dirty brute force evaluation (instead of eating my breakfast! Grumble!) of the Friedmann equations using the parameters from the StackExchange post, and I got 0.6126. You might want to post a comment on this on StackExchange.
More precisely, you should take the value of 30Gly because this is the correct value of the comoving distance that yields the data given in the text of paragraph 5, i.e. 700Myr. Please check this on the diagram by going to the intersection of the vertical line at 30Gly and the past light cone.
Rene Kail
Got it. I see your point now. Looking back, I think the main discrepancy was that when I wrote the text, I read, e.g., 0.01 on the left-hand vertical axis as 0.01 times the present age of the universe as opposed to 0.01 Gy. I revised the text as you suggested, with the 30 Gly comoving distance, which made more sense than 40 Gly (the time of emission would have been 50 My after the Big Bang, too early for galaxies to form.) Thanks!
Yes, it’s somewhat easy to get lost when reading off a complex diagram like this and infer the wrong values.
The graph also shows that we can observe the light from emission events of high z sources (like early events on the worldline of comoving distance = 30 Gly) even as these sources may not have yet entered the particle horizon and are receding with v >c.
Greetngs from Switzerland
Rene Kail
Above diagram shows that farthest object whose photons are reaching here now is around 46 billion light years far away now.
When these photons started their journey, source and destination was almost at the same location.
Please tell me how long those photons will take to reach here which were 46 billion light years far away 13.7 billion years before when they started their journey towards us. It was the same time when currenly 46 billion light years far away photons started the journey to reach here now.
Photons that were 46 billion light years from here 13.7 billion years ago will likely never reach us because of accelerating expansion. (In a “flat” spacetime with no acceleration, they would reach us but only after an insanely long amount of time.)
Thank you for your accelerated expansion fadt reply. lightning fast is not that fast.
It means above diagram does not tell the event horizon distance or particle horizon for any time in the past. Event horizon line touches 62 billion light years distance, it means particle horizon will be max 62 billion light years, doesn’t matter if we will wait upto the infinite time, no photons will ever reach here farther than this distance just like current particle horizon is 46 billion light years.
Hence I thought any photon which is under 62 billion light years will reach here someday. I think I missed the point that every photon will reach here one day which is under 62 billion light years but that distance is the distance now. That cannot be true for 13.7 billion years before 46 billion light years far object.