Dec 112012
 

fbspamThank you, Facebook. Now I am getting garbage that is apparently coming from some of my Facebook friends, all because (no doubt in your eagerness to please your corporate sponsors and push your sinking share price up a little) you happened to leave open a gaping security hole allowing spammers to “scrape” friend lists and e-mail addresses.

Worse yet, it is possible that the same spammers are sending garbage to others in my name. And while I may know not to click on an unsolicited link even if it appears to come from a good friend, colleague, or close relative, others may not be so cautious.

One of these days, I’ll find myself a spammer and slowly strangle him.

 Posted by at 10:23 pm
Dec 112012
 

ios6mapsI admit I, too, joined the happy chorus of Android phone owners ridiculing Apple’s decision to drop Google Maps in favor of a half-baked homegrown Apple solution in iOS6.

However, those bad maps are no joke. Apparently in Australia, several people found themselves in life-threatening situations when Apple’s mapping program guided them to a snake-infested desert instead of a tourist destination.

 Posted by at 9:14 pm
Dec 092012
 

Fareed Zakaria on CNN commented on a recent ranking by The Economist that they called “the lottery of life“. It measured the quality of life in some eighty countries. The United States, number 1 on similar lists in decades past, is now in a tie with Germany for position 16. (Canada is 9th.) Following Switzerland and Australia, the top of the list is dominated by the usual Scandinavian suspects: Norway, Sweden, Denmark are 3rd, 4th and 5th, respectively.

So, can’t we all be more like Scandinavians? This is more than just a rhetorical question. As a matter of fact, this is the title of a recent study by Acemoglu et al. (MIT Department of Economics Working Paper No. 12-22, 2012.) In it, the authors argue that more “cutthroat” versions of capitalism, such as that practiced in the United States, while leading to greater inequality, also lead to more innovation. Meanwhile, countries choosing a more “cuddly” form of capitalism are in fact enjoying a free ride, as they take advantage of the innovations produced by cutthroat capitalists.

The study was reportedly criticized for using patents as a proxy to measure innovation, but I don’t think that this criticism truly undermines their main conclusions. Conclusions that seem to be supported by solid mathematics (at least that’s the impression I got after quickly scanning through the pages of the actual paper). What I find interesting among the study’s conclusions is that the configuration of a technology leader practicing “cutthroat” capitalism and followers who practice “cuddly” capitalism is actually a stable, albeit asymmetric, equilibrium.

I cannot help but wonder though… where does China fit into this picture?

 Posted by at 1:17 pm
Dec 082012
 

Not only is Windows 8 a “weird” operating system (I am trying to avoid impolite language here) but it appears Microsoft is hell bent on breaking the “Windows 7 experience” for those of us who did not jump on their “tiles everywhere” bandwagon.

Today, I found out that in the name of Windows 8 support, Microsoft disabled some basic features in their update to the Remote Desktop Protocol on Windows 7. For starters, they disabled “Aero remoting”, so if you are accessing another Windows 7 computer, you will no longer see the transparency, etc. effects. But at least this “improvement” is documented.

Not so the other change: installing RDP 8 disables the “TSCLIENT share”, which is how Windows XP programs that run in Microsoft Virtual PC access files on the host computer. This is extremely annoying for people, myself included, who rely on Windows XP Mode to run older applications. Yes, there are workarounds (including the obvious one, which is to uninstall the RDP 8 update) but I still don’t understand why Microsoft messed up this feature in the first place. Let me just say that this is not the best way to make people like Windows 8 some more!

 Posted by at 6:27 pm
Dec 082012
 

One of my favorite photographs ever, in fact one that I even use on my Facebook timeline page as a background image, was taken by a certain Bill Anders when he was flying almost 400,000 km from the Earth. Anders was one of the first three members of our species who flew to another celestial body (albeit without landing on its surface; that came a bit later.)

Yesterday, I read a very interesting article about Anders, both his trip on board Apollo 8 and his life afterwards. The article also touched upon the topic of religion.

The message radioed back by the crew of Apollo 8 is probably the most memorable Christmas message ever uttered by humans. (Or maybe I am biased.) And yes, it starts with the words from Genesis, but I always viewed it the way it was presumably intended: as an expression of awe, not as religious propaganda.

The curious thing, as mentioned in the article, is that it was this trip around the Moon that changed the traditional Christian viewpoint of Anders about Earthlings created by a God in his own image.

“When I looked back and saw that tiny Earth, it snapped my world view,” Anders is quoted as saying. “Are we really that special? I don’t think so.”

Well, this pretty much sums up why I am an atheist. I’d like to believe that it’s not hubris; it’s humility.

 Posted by at 10:55 am
Dec 042012
 

I spent a lot of my misguided youth reading science fiction. I particularly liked short stories.

Dormant, written by A. E. Van Vogt, is set in the years immediately following the end of the Second World War and the first atomic explosions. The hero (if it can be called that) of the story is a giant slab of rock, which turns out to be a sentient machine that has lain dormant at the bottom of the sea for untold millions of years until it was woken by trace amounts of radioactive energy as a result of nuclear fallout in the ocean. When this 400-foot slab of rock climbs out of the sea and up a hill, it attracts the attention of the US military, which ultimately decides to destroy it with an atomic weapon. The sudden flood of energy was all Iilah (for the rock had a name) needed to wake up fully and remember its mission; after which, it destroys itself in a gigantic explosion, dislodging the Earth from its orbit and causing it to plunge into the Sun. For Iilah’s purpose was to destroy a solar system. And even if it had known that the war it was designed to fight ended eons ago, robot bombs are not designed to make up their own minds.

This story was written by Van Vogt in the 1940s but much to my delight, I just came across a sequel published on the Web in 2012. Written by a Bruce Munro and titled After Dormancy, it gives humanity, in the author’s own words, “a slightly happier ending…”

 Posted by at 4:01 pm
Dec 032012
 

Update (September 6, 2013): The analysis in this blog entry is invalid. See my September 6, 2013 blog entry on this topic for an explanation and update.

It has been a while since I last wrote about a pure physics topic in this blog.

A big open question these days is whether or not the particle purportedly discovered by the Large Hadron Collider is indeed the Higgs boson.

One thing about the Higgs boson is that it is a spin-0 scalar particle: this means, essentially, that the Higgs is identical to its mirror image. This distinguishes the Higgs from pseudoscalar particles that “flip” when viewed in a mirror.

So then, one way to distinguish the Higgs from other possibilities, including so-called pseudoscalar resonances, is by establishing that the observed particle indeed behaves either like a scalar or like a pseudoscalar.

Easier said than done. The differences in behavior are subtle. But it can be done, by measuring the angular distribution of decay products. And this analysis was indeed performed using the presently available data collected by the LHC.

Without further ado, here is one view of the data, taken from a November 14, 2012 presentation by Alexey Drozdetskiy:
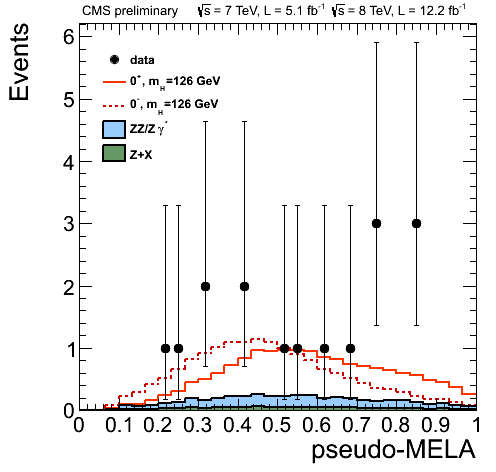
The solid red line corresponds to a scalar particle (denoted by 0+); the dotted red line to a pseudoscalar (0−). The data points represent the number of events. The horizontal axis represents a “Matrix Element Likelihood Analysis” value, which is constructed using a formula similar to this one (see arXiv:1208.4018 by Bolognesi et al.):

$${\cal D}_{\rm bkg}=\left[1+\frac{{\cal P}_{\rm bkg}(m_{4\ell};m_1,m_2,\Omega)}{{\cal P}_{\rm sig}(m_{4\ell};m_1,m_2,\Omega)}\right]^{-1},$$

where the \({\cal P}\)-s represent probabilities associated with the background and the signal.

So far so good. The data are obviously noisy. And there are not that many data points: only 10, representing 16 events (give or take, as the vertical error bars are quite significant).

There is another way to visualize these values: namely by plotting them against the relative likelihood that the observed particle is 0+ or 0−:
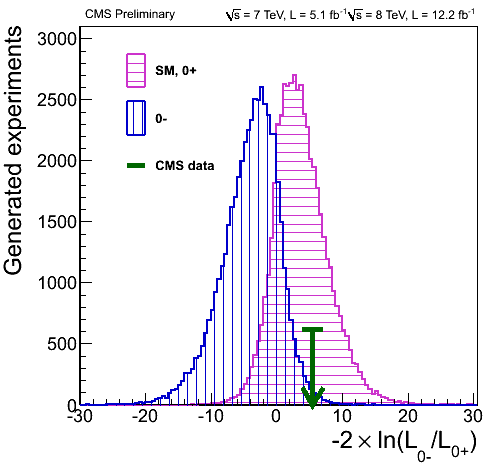
In this fine plot, the two Gaussian curves correspond to Monte-Carlo simulations of the scalar and pseudoscalar scenarios. The position of the green arrow is somehow representative of the 10 data points shown in the preceding plot. The horizontal axis in this case is the logarithm of a likelihood ratio.

On the surface of it, this seems to indicate that the observed particle is indeed a scalar, just like the Higgs. So far so good, but what bothers me is that this second plot does not indicate uncertainties in the data. Yet, judging by the sizable vertical error bars in the first plot, the uncertainties are significant.

However, to relate the uncertainties in the first plot, one has to be able to relate the likelihood ratio on this plot to the MELA value on the preceding plot. Such a relationship indeed exists, given by the formula

$${\cal L}_k=\exp(-n_{\rm sig}-n_{\rm bkg})\prod_i\left(n_{\rm sig}\times{\cal P}^k_{\rm sig}(x_i;\alpha;\beta)+n_{\rm bkg}\times{\cal P}_{\rm bkg}(x_i;\beta)\right).$$

The problem with this formula, from my naive perspective, is that in order to replicate it, I would need to know not only the number of candidate signal events but also the number of background events, and also the associated probability distributions and values for \(\alpha\) and \(\beta\). I just don’t have all the information necessary to reconstruct this relationship numerically.

But perhaps I don’t have to. There is a rather naive thing one can do: and that would be simply calculating the weighted average of the data points in the first plot. When I do this, I get a value of 0.57. Lo and behold, it has roughly the same relationship to the solid red Gaussian in that plot as the green arrow to the 0+ Gaussian in the second.

Going by the assumption that my naive shortcut actually works reasonably well, I can take the next step. I can calculate a \(1\sigma\) error on the weighted average, which yields \(0.57^{+0.24}_{-0.23}\). When I (admittedly very crudely) try the transcribe this uncertainty to the second plot, I get something like this:
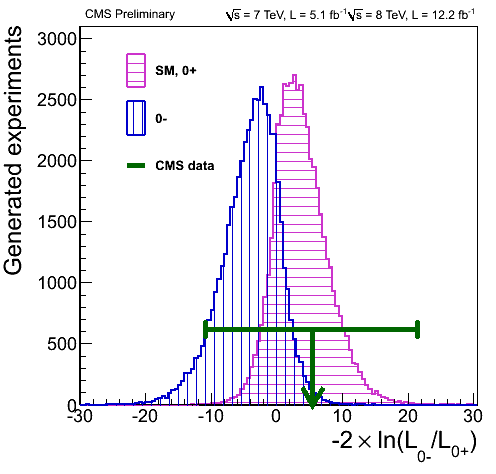
Yes, the error is this significant. So while the position of the green arrow is in tantalizing agreement with what one would expect from a Higgs particle, the error bar says that we cannot draw any definitive conclusions just yet.

But wait, it gets even weirder. Going back to the first plot, notice the two data points on the right. What if these are outliers? If I remove them from the analysis, I get something completely different: namely, the value of \(0.43^{+0.26}_{-0.21}\). Which is this:
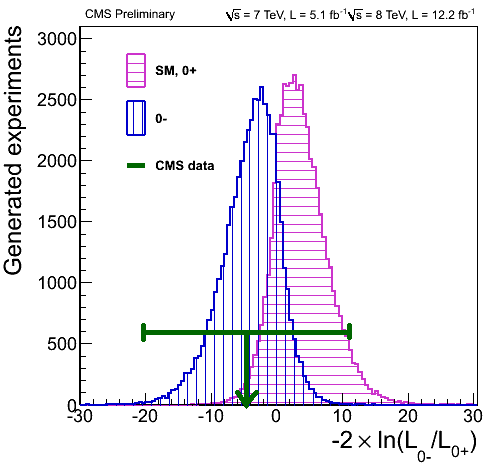
So without the outliers, the data actually favor the pseudoscalar scenario!

I have to emphasize: what I did here is rather naive. The weighted average may not accurately represent the position of the green arrow at all. The coincidence in position could be a complete accident. In which case the horizontal error bar yielded by my analysis is completely bogus as well.

I also attempted to check how much more data would be needed to reduce the size of these error bars sufficiently for a true \(1\sigma\) result: about 2-4 times the number of events collected to date. So perhaps what I did is not complete nonsense after all, because this is what knowledgeable people are saying: when the LHC collected at least twice the amount of data it already has, we may know with reasonable certainty if the observed particle is a scalar or a pseudoscalar.

Until then, I hope I did not make a complete fool of myself with this naive analysis. Still, this is what blogs are for; I am allowed to say foolish things here.

 Posted by at 10:31 pm
Dec 022012
 

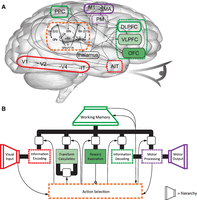
I am reading about this “artificial brain” story that has been in the news lately, about a Waterloo team that constructed a software model, Spaun, of a human-like brain with several million neurons.

Granted, several million is not the same as a hundred billion or so neurons that are in a real human brain, but what they have done still appears to be an impressive result.

I’ve spent a little bit of time trying to digest their papers and Web site. It appears that a core component of their effort is Nengo, a neural simulator. Now the idea of simulating neurons has been at the core of cybernetics for (at least) 60 years, but Nengo adds a new element: its ability to “solve” a neural network and determine the optimal connection weights for a given network to achieve its desired function.

The “brain”, then, is a particular Nengo simulation that is designed to model specific areas and functions of the human brain. Their simulation, equipped with a simple 28×28 pixel “eye” and a simulated “arm” with which to draw, can perform some simple activities such as reading and copying some digits and symbols, or memorizing a list.

I am still trying to make up my mind as to whether this result is just a gimmick like Grey Walter’s infamous cybernetic tortoise or a genuine leap forward, but I am leaning towards the latter. Unlike the tortoise, which just superficially mimicked some behavior, Spaun is a genuine attempt to create a machine that actually mimics the functioning of a human brain. Indeed, if this research is scalable, it may mark a milestone that would eventually lead to the ability to create electronic backups of ourselves. Now whether or not that is a Good Thing is debatable of course.

 Posted by at 6:27 pm
Dec 022012
 

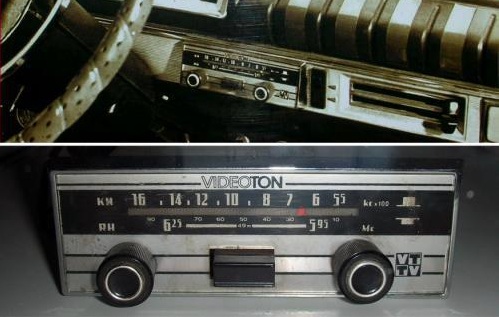
I came across this picture on Facebook the other day, a photo of the cheapest car radio made in Hungary back in the 1970s. It was a very basic radio manufactured by Hungary’s dominant electronics manufacturer Videoton. We had the exact same type of radio in the exact same model car (a Lada 1200 if I am not mistaken) when I was in grade school.

Funny thing about this receiver is that it wasn’t an AM-FM radio. It was an AM + shortwave radio, with a single shortwave band tuned to 49 meters.

The same 49-meter shortwave band that was the preferred band used by Cold War era propaganda stations broadcasting in Hungarian, including Radio Free Europe, Voice of America, the BBC, Deutsche Welle, even The Vatican.

We lived in the town of Visegrad at the time, only 40 km north of Budapest but separated from the capital by some hills. Because of the terrain, reception of Budapest stations was often spotty. Which may explain why this little car radio had trouble tuning to the 2 MW transmitter of Radio Kossuth, located in central Hungary, but had no trouble at all with the reception of the aforementioned propaganda stations; those were always crystal clear.

As to why a communist-era state-owned electronics factory was manufacturing a car radio with such excellent short wave sensitivity, I have no idea. Perhaps, in an early experiment with capitalism, they were trying to respond to market demand?

 Posted by at 3:17 pm