Our second short paper has been accepted for publication in Physical Review Letters.
I have been involved with Pioneer 10 and 11 in some fashion since about 2002, when I first began corresponding with Larry Kellogg about the possibility of resurrecting the telemetry data set. It is thanks the Larry’s stamina and conscientiousness that the data set survived.
I have been involved actively in the research of the Pioneer anomaly since 2005. Seven years! Hard to believe.
This widely reported anomaly concerns the fact that when the orbits of Pioneer 10 and 11 are accurately modeled, a discrepancy exists between the modeled and measured frequency of the radio signal. This discrepancy can be resolved by assuming an unknown force that pushes Pioneer 10 an 11 towards the Earth or the Sun (from that far away, these two directions nearly coincide and cannot really be told apart.)
One purpose of our investigation was to find out the magnitude of the force that arises as the spacecraft radiates different amounts of heat in different directions. This is the concept of a photon rocket. A ray of light carries momentum. Hard as it may appear to believe at first, when you hold a flashlight in your hands and turn it on, the flashlight will push your hand backwards by a tiny force. (How tiny? If it is a 1 W bulb that is perfectly efficient and perfectly focused, the force will be equivalent to about one third of one millionth of a gram of weight.)
On Pioneer 10 and 11, we have two main heat sources. First, there is electrical heat: all the instruments on board use about 100 W of electricity, most of which is converted into heat. Second, electricity is produced, very inefficiently, by a set of four radioisotope thermoelectric generators (RTGs); these produce more than 2 kW of waste heat. All this heat has to go somewhere, and most of this heat will be dissipated preferably in one direction, behind the spacecraft’s large dish antenna, which is always pointed towards the Earth.
The controversial question was, how much? How efficiently is this heat converted into force?
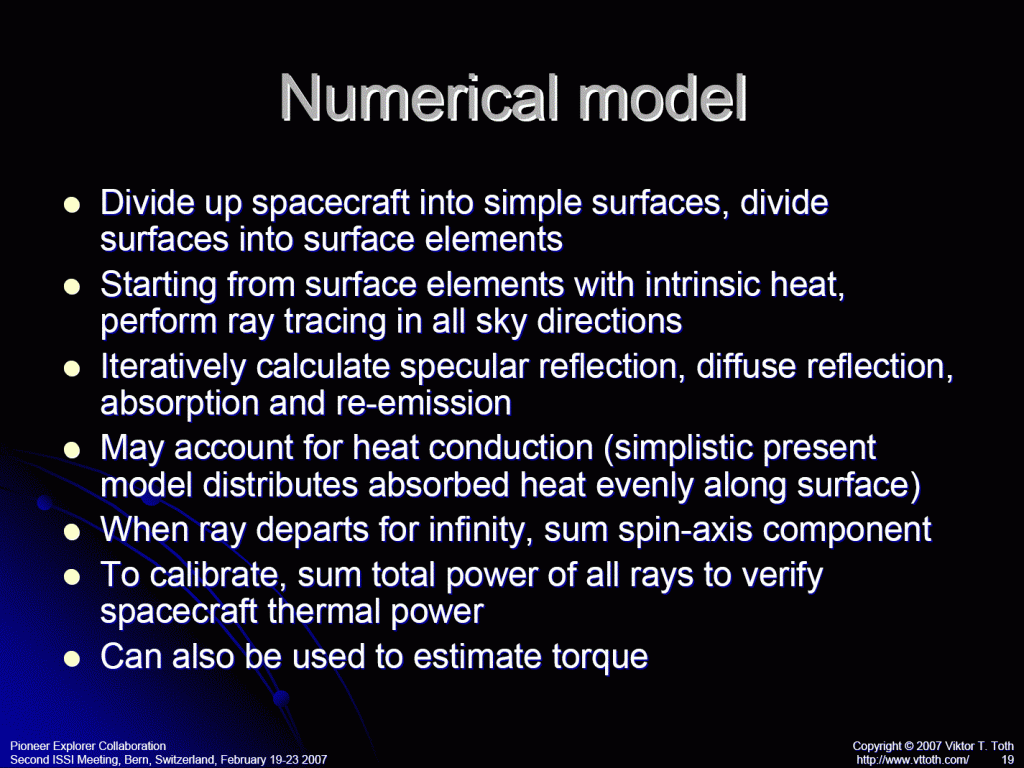
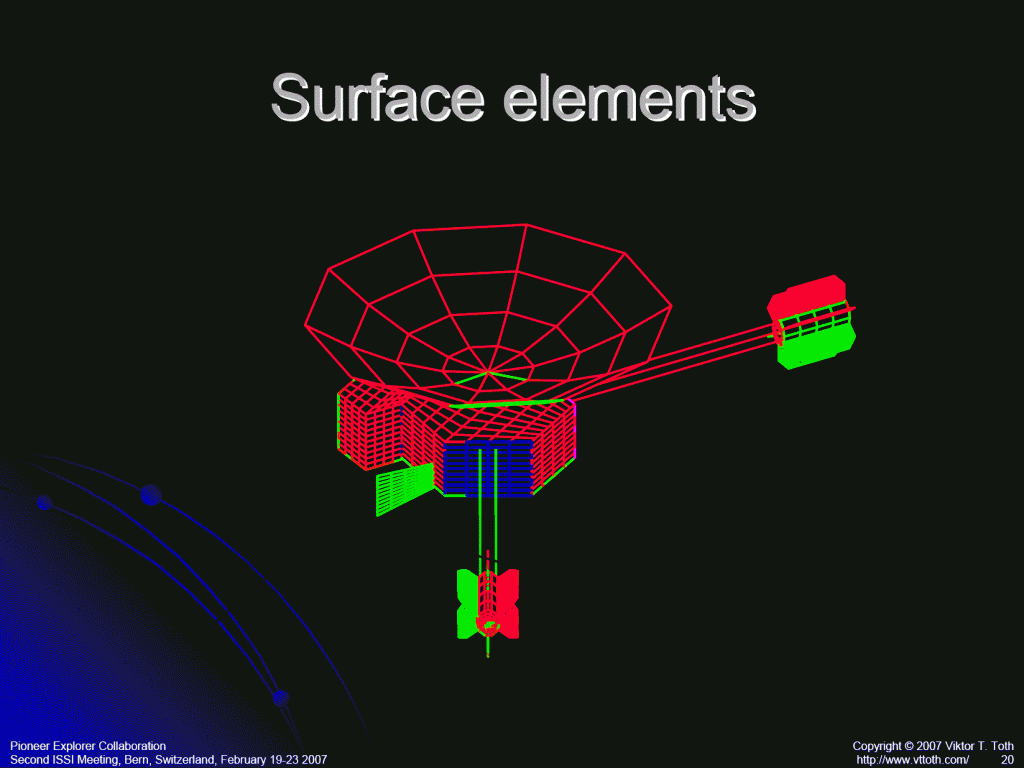
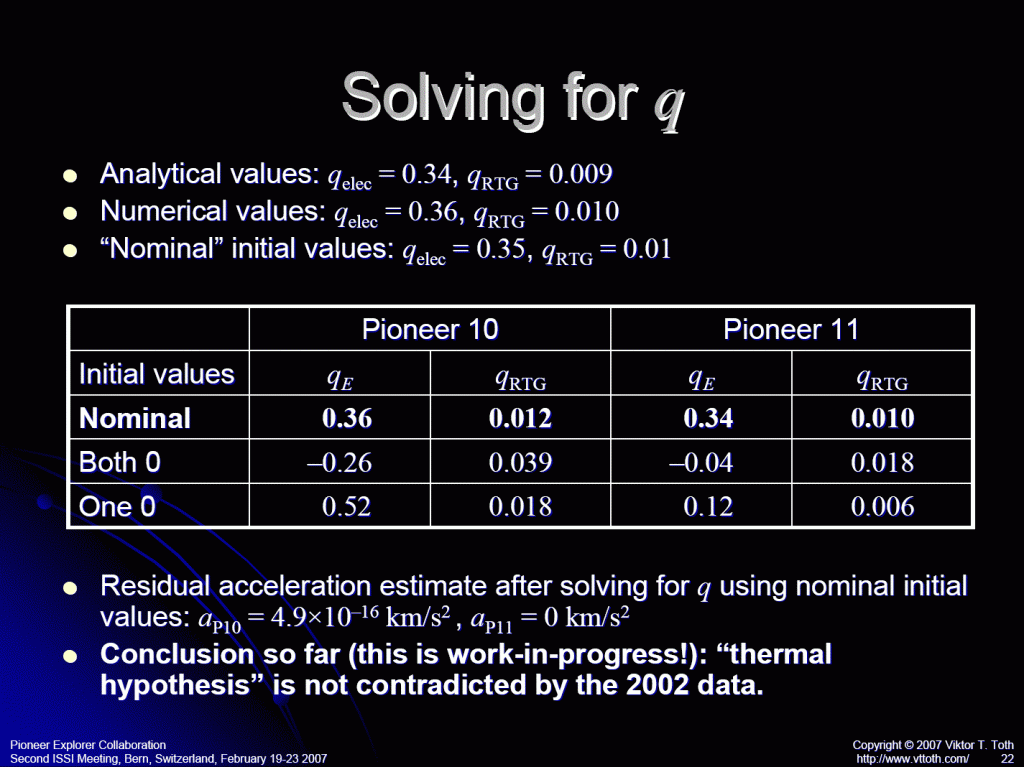
I first constructed a viable thermal model for Pioneer 10 back in 2006. I presented results from custom ray-tracing code at the Pioneer Explorer Collaboration meeting at the International Space Science Institute in Bern, Switzerland in February 2007:
With this, I confirmed what has already been suspected by others—notably, Katz (Phys. Rev. Letters 83:9, 1892, 1999); Murphy (Phys. Rev. Letters 83:9, 1890, 1999); and Scheffer (Phys. Rev. D, 67:8, 084021, 2003)—that the magnitude of the thermal recoil force is indeed comparable to the anomalous acceleration. Moreover, I established that the thermal recoil force is very accurately described as a simple linear combination of heat from two heat sources: electrical heat and heat from the RTGs. The thermal acceleration \(a\) is, in fact
$$a=\frac{1}{mc}(\eta_{\rm rtg}P_{\rm rtg} + \eta_{\rm elec}P_{\rm elec}),$$
where \(c\simeq 300,000~{\rm km/s}\) is the speed of light, \(m\simeq 250~{\rm kg}\) is the mass of the spacecraft, \(P_{\rm rtg}\sim 2~{\rm kW}\) and \(P_{\rm elec}\sim 100~\rm {W}\) are the RTG heat and electrical heat, respectively, and \(\eta_{\rm rtg}\) and \(\eta_{\rm elec}\) are “efficiency factors”.
This simple force model is very useful because it can be incorporated directly into the orbital model of the spacecraft.
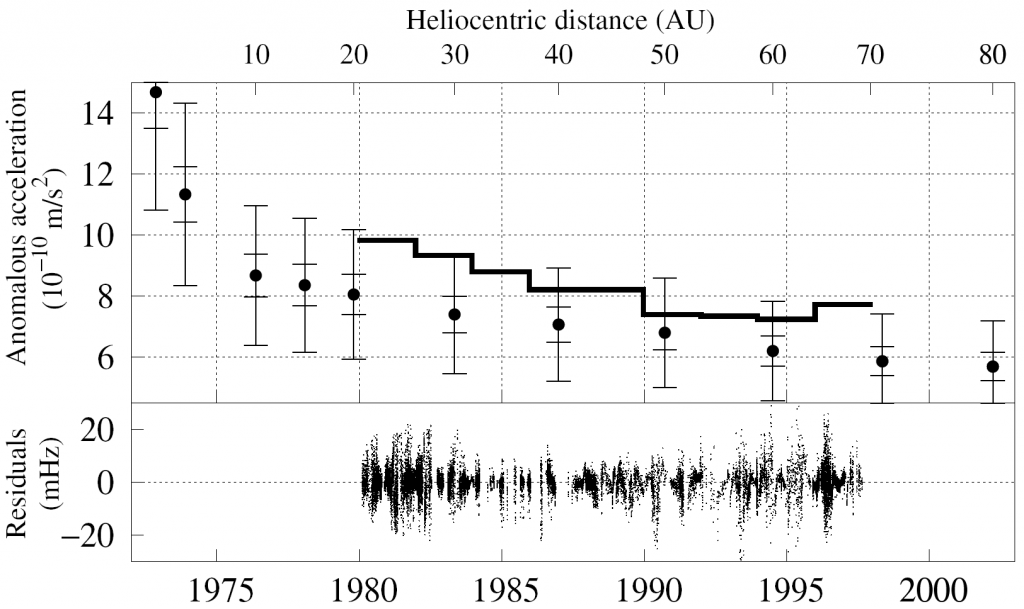
In the years since, the group led by Gary Kinsella constructed a very thorough and comprehensive model of the Pioneer spacecraft, using the same software tools (not to mention considerable expertise) that they use for “live” spacecraft. With this model, they were able to predict the thermal recoil force with the greatest accuracy possible, at different points along the trajectory of the spacecraft. The result can be compared directly to the acceleration that is “measured”; i.e., the acceleration that is needed to model the radio signal accurately:
In this plot, the step-function like curve (thick line) is the acceleration deduced from the radio signal frequency. The data points with vertical error bars represent the recoil force calculated from the thermal model. They are rather close. The relatively large error bars are due primarily to the fact that we simply don’t know what happened to the white paint that coated the RTGs. These were hot (the RTGs were sizzling hot even in deep space) and subjected to solar radiation (ultraviolet light and charged particles) so the properties of the paint may have changed significantly over time… we just don’t know how. The lower part of the plot shows just how well the radio signal is modeled; the average residual is less than 5 mHz. The actual frequency of the radio signal is 2 GHz, so this represents a modeling accuracy of less than one part in 100 billion, over the course of nearly 20 years.
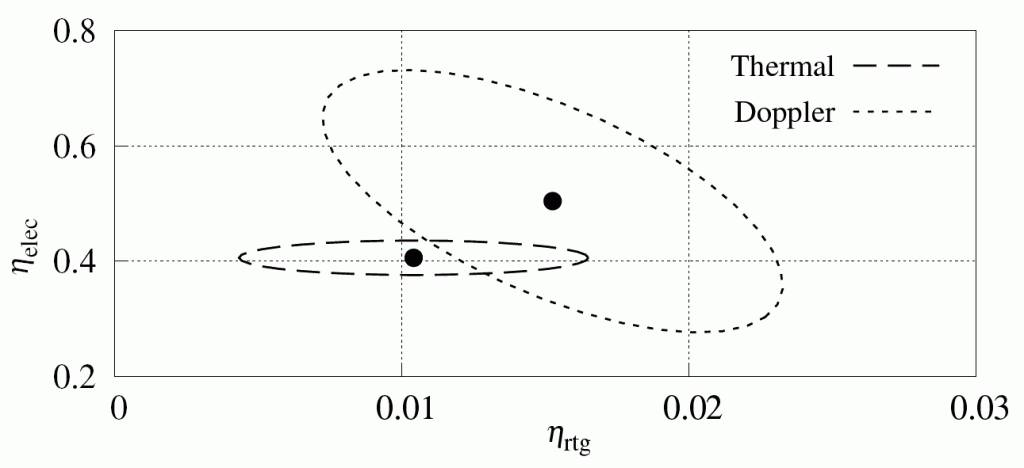
In terms of the above-mentioned efficiency factors, the model of Gary’s group yielded \(\eta_{\rm rtg}=0.0104\) and \(\eta_{\rm elec}=0.406\).
But then, as I said, we also incorporated the thermal recoil force directly into the Doppler analysis that was carried out by Jordan Ellis. Jordan found best-fit residuals at \(\eta_{\rm rtg}=0.0144\) and \(\eta_{\rm elec}=0.480\). These are somewhat larger than the values from the thermal model. But how much larger?
We found that the best way to answer this question was to plot the two results in the parameter space defined by these two efficiency factors:
The dashed ellipse here represents the estimates from the thermal model and their associated uncertainty. The ellipse is elongated horizontally, because the largest source of uncertainty, the degradation of RTG paint, affects only the \(\eta_{\rm rtg}\) factor.
The dotted ellipse represents the estimates from radio signal measurements. The formal error of these estimates is very small (the error ellipse would be invisibly tiny). These formal errors, however, are calculated by assuming that the error in every one of the tens of thousands of Doppler measurements arises independently. In reality, this is not the case: the Doppler measurements are insanely accurate, any errors that occur are a result of systematic mismodeling, e.g., caused by our inadequate knowledge of the solar system. This inflates the error ellipse and that is what was shown in this plot.
Looking at this plot was what allowed us to close our analysis with the words, “We therefore conclude that at the present level of our knowledge of the Pioneer 10 spacecraft and its trajectory, no statistically significant acceleration anomaly exists.”
Are there any caveats? Not really, I don’t think, but there are still some unexplored questions. Applying this research to Pioneer 11 (I expect no surprises there, but we have not done this in a systematic fashion). Modeling the spin rate change of the two spacecraft. Making use of radio signal strength measurements, which can give us clues about the precise orientation of the spacecraft. Testing the paint that was used on the RTGs in a thermal vacuum chamber. Accounting for outgassing. These are all interesting issues but it is quite unlikely that they will alter our main conclusion.
On several occasions when I gave talks about Pioneer, I used a slide that said, in big friendly letters,
PIONEER 10/11 ARE THE MOST PRECISELY NAVIGATED DEEP SPACE CRAFT TO DATE.
And they confirmed the predictions of Newton and Einstein, with spectacular accuracy, by measuring the gravitational field of the Sun in situ, all the way up to about about 70 astronomical units (the distance of the Earth from the Sun).
[…] latest Pioneer paper, in which we discuss the results from the Pioneer thermal model and its incorporation into the […]