 Reader’s Digest recently conducted an interesting experiment: they “lost” 12 wallets, filled with about $50 worth of cash and sufficient documentation to locate the owner, in 16 cities around the world. The result: Finns in Helsinki are the most honest with 11 of the 12 wallets returned, whereas in Lisbon, Portugal, the sole wallet that was returned was, in fact, found by a visiting Dutch couple. Finns needless to say, are rejoicing: “we don’t even run red lights,” boasted a Helsinki resident.
So what can we conclude from this interesting experiment? Perhaps shockingly, almost nothing.
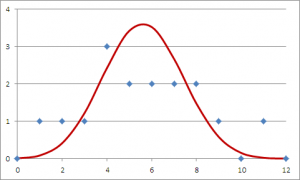
This becomes evident if I plot a histogram with the number of wallets returned, and overlay on it a binomial distribution for a probability of 46.875% (which corresponds to the total number of wallets returned, 90 out of 192), I get a curve that is matched very closely by the histogram. Unsurprisingly, there will be a certain probability that in a given city, 1, 2, 3, etc. wallets are returned; and the results of Reader’s Digest match this prediction closely.
So there is no reason for Finns to rejoice or for the Portuguese to feel shame. It’s all just blind luck, after all. And the only valid conclusion we can draw from this experiment is that people are just as likely to be decent folks in Lisbon as in Helsinki.
But how do you explain this to a lay audience? More importantly, how do you prevent a political demagogue from drawing false or unwarranted conclusions from the data?