Recently, I came across an interesting article by a Jonathan Jarry from McGill University, suggesting that the much heralded Dunning-Kruger effect is not real, but a data analysis artifact.
Here is the famous Dunning-Kruger graph:
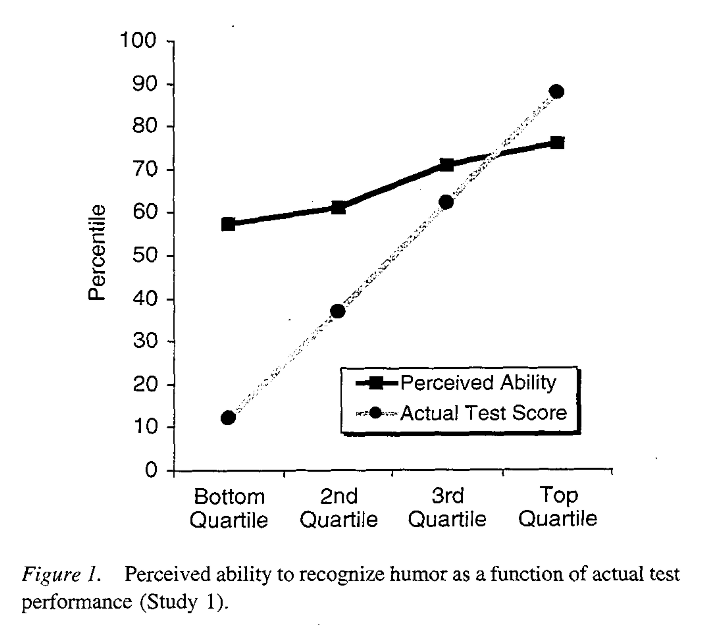
The usual interpretation is that those in the bottom quartile significantly overestimated their ability. This is the famous Dunning-Kruger effect.
But, Jarry says, a completely random model yields a very similar-looking graph:
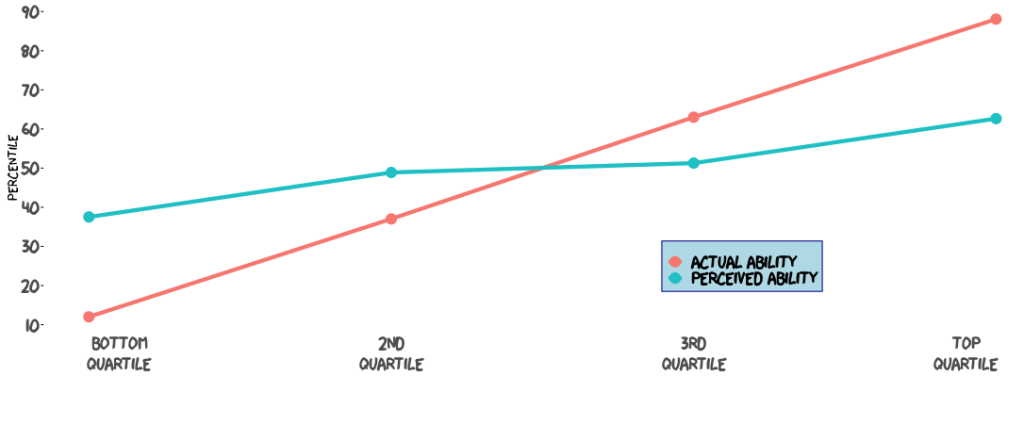 and thus concludes that the Dunning-Kruger effect may not be real after all.
But wait. When we compare the two graphs, there are qualitative similarities but also striking differences. Notice how, in the second graph, the two curves intersect each other at roughly the halfway point. That makes perfectly good sense: If the model is that people in all four quartiles fail to assess their abilities accurately at the same rate, those in the bottom quartile will overestimate their ability just as much as those in the top quartile underestimate theirs. This would be the effect of random noise.
However, when we look at the original Dunning-Kruger curve, this is not what we see. Those in the bottom quartile overestimate their ability to a much greater extent than those in the top quartile underestimate theirs. Even in the 3rd quartile, people tended to overestimate their abilities, though only slightly, by the same amount as those in the top quartile underestimated theirs. So what the original Dunning-Kruger curve actually appears to show is a more ore less random spread in the 3rd and top quartiles, but significant bias in the bottom and 2nd quartiles, consistent with the notion that people in these quartiles overestimate their abilities.
Of course it would be nice to see a proper statistical analysis that also evaluates the statistical significance of the finding, but a simple, qualitative comparison of the two plots seems to show is that the Dunning-Kruger effect is real, after all.